Our Indicators and Alerts
Exhaustion
Over the years Ross Clark has programmed many trading rules and developed two proprietary indicators . The indicators are designed to find excesses within trends.
The Exhaustion Index looks at the strength and longevity of the underlying price trend.
The Summation Index is an oscillator that monitors short-term movement measuring the urgency that investors are exhibiting in their decisions. It includes functions that prevent it from becoming easily over extended in trending markets but allows for more frequent signals within non-trending phases.
When both indicators reach simultaneous extremes, the underlying market is considered to be registering an Upside Exhaustion Alert or a Downside Capitulation. When such alerts occur in multiple time frames (daily, weekly or monthly) they are deemed to have more significance. We classify them as ‘Trifectas” when they occur in three time frames. Such examples were the top of gold in 1980, Nikkei in 1989, T-Bonds in 1993, silver in 2011, Biotech’s in 2015, Bitcoin in December 2017 and S&P and Dow in January 2018, ,

Springboard and CAP II Alerts
These are our "Buy the dips" tools.
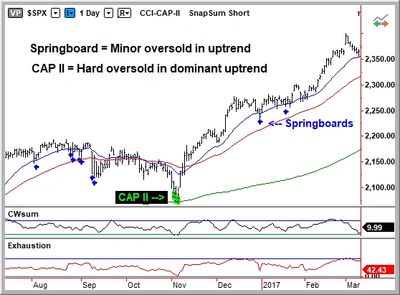
Springboards are designed to identify oversold conditions within a rising trend. These generally occur when prices retrace to a rising 20 or 50-period exponential moving average.
CAP II's are a style of Capitulation that appears on severe corrections within dominant uptrends.

Capitulation Alerts
"Falling knives"
Our definition of Capitulation requires that the Exhaustion and Summation Indices both be oversold and that the trend is down and climactic. Look for other indications of a bottom including stability in the next longer time frame, improved money flow and Sequential or Combo buys.

Copyright © 2025 ChartsandMarkets.com - All Rights Reserved.https://img1.wsimg.com/isteam/ip/237d4c04-2f33-46a2-ae8f-fa026c40b5d8/LIT%20241011.jpg/:/rs=w:70,h:70,cg:true,m/cr=w:70,h:70,a:cc